Iowa Liquor Sales Analysis
Analysis of Iowa liquor sales performance, regional trends, seasonal patterns, and product-level insights using 2021 sales data.
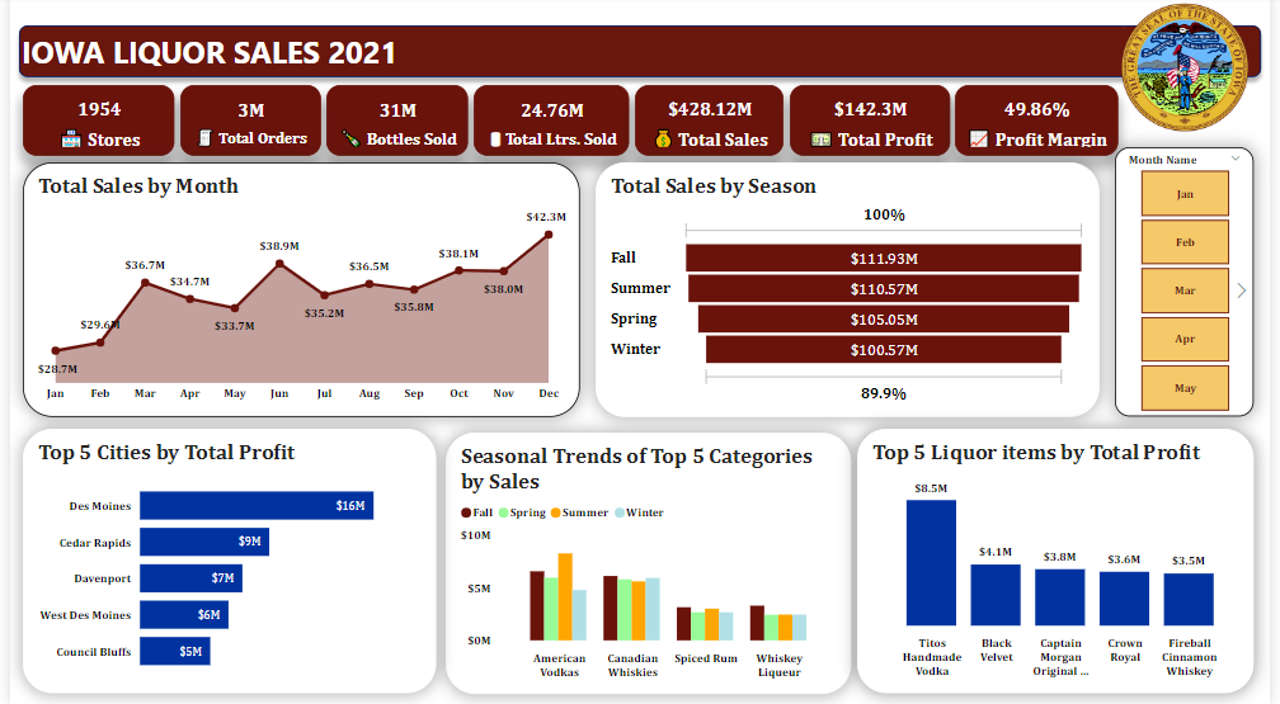
Overview
This project analyzes the Iowa Liquor Sales dataset to understand liquor sales performance, seasonal demand patterns, and consumer purchasing behavior across stores, cities, counties, vendors, and product categories. The dataset captures spirits purchase records for Iowa Class “E” liquor license holders between January 2021 and January 2022.
The analysis focuses on identifying high-performing and low-performing liquor items, understanding which locations generated the highest sales, and examining how liquor sales changed across the seasons.
Objective
The goal of this project was to explore large-scale liquor sales data and build a dashboard that highlights sales performance, profitability, seasonal sales patterns, and regional demand trends across Iowa.
Business Questions
- Which liquor items generated the highest and lowest sales?
- Which counties and cities recorded the highest liquor sales?
- How did liquor sales vary across the seasons?
- What patterns can be observed in store activity, product demand, and profitability?
Dataset
The analysis uses the Iowa Liquor Sales dataset published by the Iowa Department of Revenue, Alcoholic Beverages Division. The original dataset contains 24 columns and 2,805,307 rows, with fields covering order dates, stores, cities, counties, product categories, vendors, bottles sold, sales value, and sales volume.
My Approach
I worked with a duplicate copy of the dataset in Power BI, where I carried out preprocessing and exploratory analysis. I transformed the data to support reporting, built measures for sales and profit analysis, and designed dashboard views to examine overall sales performance, store activity, regional sales distribution, seasonal patterns, and top-performing products.
Tools Used
- Power BI for data transformation, analysis, and dashboard development
- Iowa Liquor Sales dataset from the Iowa Department of Revenue
Key Insights
- The dataset covered 1,954 stores and 57 liquor categories, providing a broad view of Iowa’s liquor retail activity.
- More than 3 million orders were recorded, with over 31 million bottles sold during the analysis period.
- Total liquor sales reached $428.12 million, generating an estimated profit of $142.30 million and a profit margin of 49.86%.
- A total of 24.76 million liters of liquor were sold, showing the scale of demand across the state.
- Sales varied across the seasons, with fall recording the highest sales and winter showing comparatively lower sales activity.
- The analysis revealed clear differences in performance across counties, cities, stores, vendors, and liquor categories.
What I Learned
This project strengthened my ability to work with large transactional sales data in Power BI and translate raw records into business-focused insights. I practiced building measures for sales and profitability, analyzing seasonality in retail data, and designing visuals that compare performance across products, locations, and stores in a way that is easy to interpret.
Result
The final output is an interactive Power BI dashboard that presents liquor sales trends, profitability, seasonal patterns, regional sales distribution, and product-level performance across Iowa. The project provides a structured view of consumer purchasing behavior and highlights how sales performance differs across locations, seasons, and liquor categories.